DAILY PIVOT POINTS
Professional forex traders and market makers use pivot points to identify potential support and resistance levels. Pivot points are some of the most important levels to watch for short-term trading.
Simply put, a pivot point and its support/resistance levels are areas at which the direction of price movement can possibly change.
The reason why pivot points are so enticing?
It’s because they are OBJECTIVE.
Unlike some of the other indicators that we’ve taught you about already, there’s no discretion involved.
In many ways, forex pivot points are very similar to Fibonacci levels. Because so many people are looking at those levels, they almost become self-fulfilling.
The major difference between the two is that with Fibonacci, there is still some subjectivity involved in picking Swing Highs and Swing Lows.
Many traders keep an eye on these levels and you should too.
Pivot points are especially useful to short-term traders.
Just like normal support and resistance levels, forex traders can choose to trade the bounce or the break of these levels.
Here is an example of our Daily Pivot points indicator in action:

How To Use Pivot Points For Range Trading
The simplest way to use pivot point levels in your forex trading is to use them just like your regular support and resistance levels.
The benefit of having a Pivot Point indicator is that your pivot points will be automatically calculated and displayed on your chart everyday.
The more times a currency pair touches a pivot level then reverses, the stronger the level is.
Actually, “pivoting” simply means reaching a support or resistance level and then reversing.
If you see that a pivot level is holding, this could give you some good trading opportunities.
If price is nearing the upper resistance level, you could SELL the pair and place a stop just above the resistance.
If price is nearing a support level, you could BUY and put your stop just below the level.
See? Just like your regular support and resistance! Nothing hard about that!
Let’s take a look at an example so you can visualize this. Here’s a 15-minute chart of GBP/USD.

In the chart above, you see that price is testing the S1 support level. If you think it will hold, what you can do is buy at market and then put a stop loss order past the next support level.
If you’re conservative, you can set a wide stop just below S2. If price reaches past S2, chances are it won’t be coming back up, as both S1 and S2 could become resistance levels.
If you’re a little more aggressive and confident that support at S1 would hold, you can set your stop just below S1.
As for your take profit points, you could target PP or R1, which could also provide some sort of resistance. Let’s see what happened if you bought at market.
As you can see in the example below S1 support level held and if you targeted the PP (pivot point).

How To Use Pivot Points to Trade Breakouts
Just like your normal support and resistance levels, pivot point levels won’t hold forever.
Using pivot points for range trading will work, but not all the time. In those times that these levels fail to hold, you should have some tools ready in your forex toolbox to take advantage of the situation!
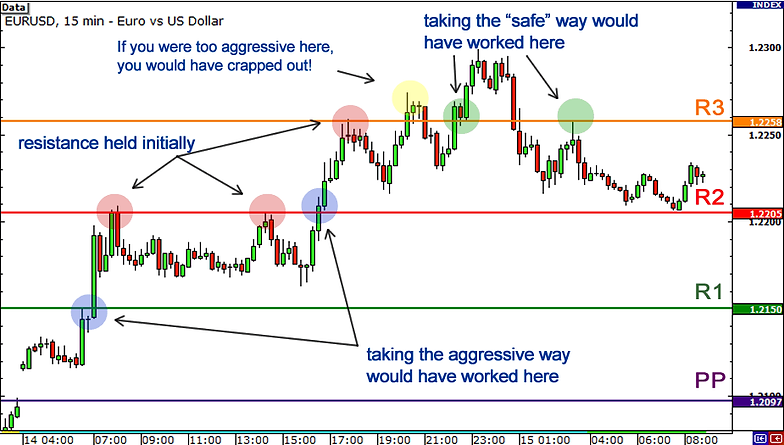
Let’s take a look at a chart to see potential breakout trades using pivot points. Below is a 15-minute chart of EUR/USD.
Here we see EUR/USD made a strong rally throughout the day.
We see that EUR/USD opened by gapping up above the pivot point. Price made a strong move up, before pausing slightly at R1.
Eventually, resistance broke and the pair jumped up by 50 pips!
If you had taken the aggressive method, you would have caught the initial move and been celebrating like you just won the World Cup.
On the other hand, if you had taken the safe way and waited for a retest, you would have been one sad little trader. The price did not retest after breaking R1. In fact, the same thing happened for both R1 and R2!
Notice how EUR/USD bulls tried to make a run for R3 as well.
However, if you had taken the aggressive method, you would have gotten caught up in a fakeout as the price failed to sustain the initial break. If your stop was too tight, then you would have gotten stopped out.
Later on though, you’ll see that the price eventually broke through. Notice how there was also a retest of the broken resistance line.
Also, observe how when the pair reversed later in the day and broke down past R3. There was an opportunity to take a short on the retest of resistance-turned-support-turned resistance (read that again if you have to!).