
Trading Divergence
Divergence is essentially just comparing price action to the movement of an indicator, when we observe a discrepancy between the price action and the indicator this is known as divergence. The most common indicators traders use for divergence are RSI & MACD.
Divergence is implemented into a trading strategy to spot a possible trend reversal.
There are two types of divergences: bullish and bearish.
Bullish Divergence
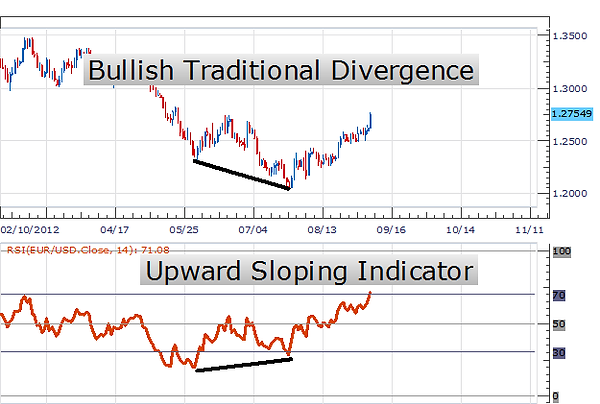
Bullish divergence occurs when the price reaches a lower low but your indicator reaches a higher low.
This normally occurs at the end of a DOWNTREND.
In this example we will be using the RSI indicator to identify divergence.
Bearish Divergence
Now, bearish divergence occurs when price makes a higher high but the indicator fails to make a higher high.
This divergence can be found at the end of UPTREND. After price reaches its higher high, if the indicator doesn't make a higher high, then we can expect price to reverse to the downside.

How to Trade Divergence
In this example we are going to be looking at USD/CHF and using the Stochastic Oscillator to identify the divergence.

We can see from the chart below that USD/CHF has been in a down trend and is showing possible signs of reversal. Price has made a lower low but the indicator has failed to make a lower low.
So is it time to buy?

As you can see from the chart above price reversed, broke the down trend and has now started up trending.
Divergence can be strong indication of a possible reversal of a trend but isn't a stand alone trading strategy. We recommend implementing this into your existing trading plan or at least combining it with other aspects of technical analysis such as support and resistance.